
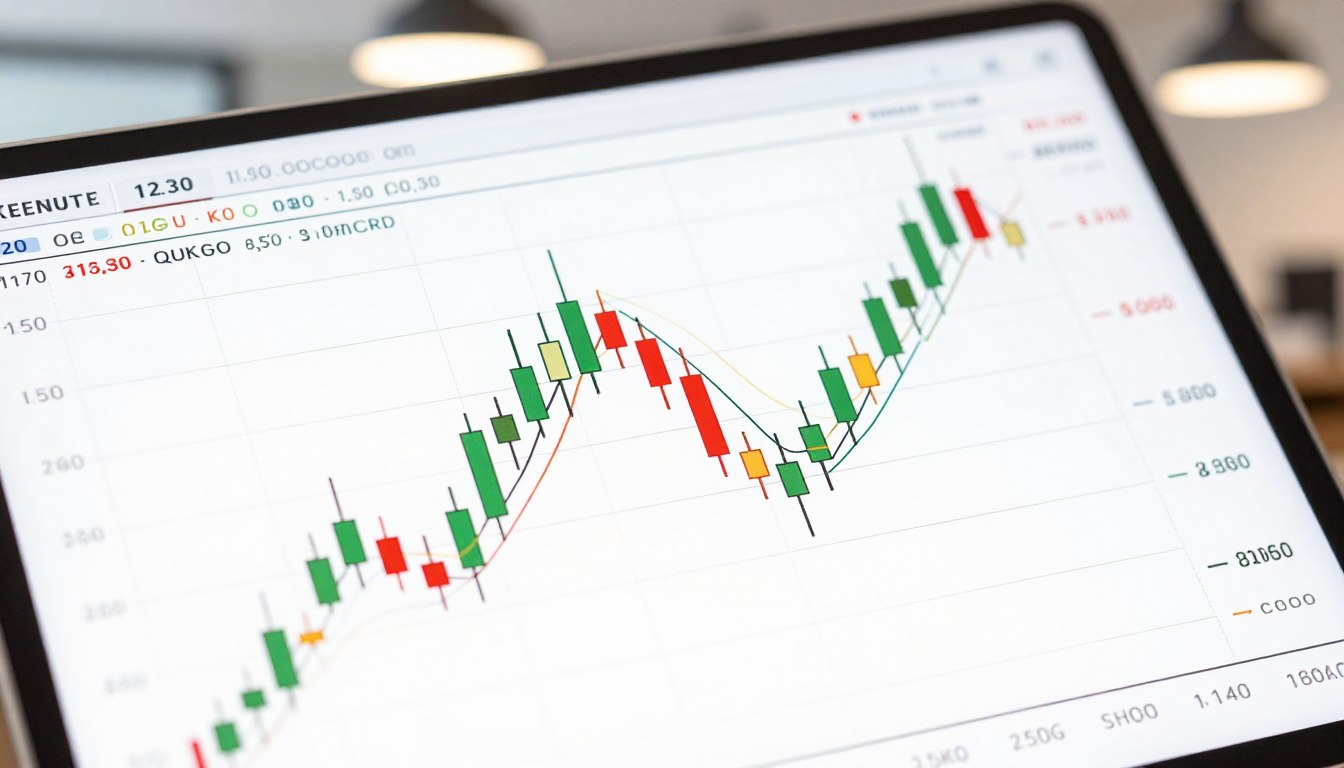
Over 90% of active traders use visual data for quick decisions in the stock market. This shows why understanding price action matters to anyone seeking success in a fast-paced market. These tools, called japanese candlesticks, turn raw numbers into a clear story about buyers and sellers. Reading their shapes offers deeper insight into market sentiment across different time frames.
This guide explains how to use candlestick charts to sharpen your strategy. We cover reliable patterns, entry timing, and effective risk management. No visual model guarantees a win, but these signals build a strong foundation for your trading journey. Let’s explore how to read the market like a professional.
Why Candlestick Charts Matter for Day Traders
Japanese candlesticks show the ongoing battle between buyers and sellers. They turn raw data into visuals, helping traders read market sentiment within seconds. This clarity matters when you navigate the fast-paced stock market.
What Japanese Candlesticks Reveal About Price Action
At their core, japanese candlesticks show supply and demand within a set time. Each candle records the opening, high, low, and closing prices. Together, these values show whether bulls or bears control price action.
Unlike basic data points, these charts show traders’ emotions. During market analysis, you read the shared psychology of other traders. Spotting these shifts early may separate a profitable trade from a missed opportunity.
How Candlestick Charts Differ From Line and Bar Charts
Line charts track only closing prices, while candlestick charts show more data. Bar charts also show high, low, open, and close values, but colored bodies offer faster visual clues. The table below compares these common charting methods.
| Chart Type | Visual Clarity | Data Depth | Best Use Case |
|---|---|---|---|
| Line Chart | High | Low | Long-term trends |
| Bar Chart | Medium | High | Detailed analysis |
| Candlestick Chart | Very High | High | Day trading |
What Readers Will Learn About Trends, Patterns, and Trade Timing
This guide shows how technical analysis can help identify high-probability setups. You will spot emerging trends and read candlestick patterns that may signal reversals or continuations. These skills can improve the timing of your entries and exits.
No single indicator guarantees success in the stock market. You will combine market analysis with disciplined risk management and use proven technical analysis instead of guesswork. This approach helps you build a strong strategy.
Learn the Four Parts of Every Candlestick
Every price move tells a story, and Japanese candlesticks form its alphabet. Their visual parts help you understand market sentiment. This skill is essential for anyone learning price action in financial markets.
Reading the Open, High, Low, and Close
Each candle covers a set time frame and shows four key data points. These points are the Open, High, Low, and Close, often called OHLC. The Open and Close mark the period’s boundaries; the High and Low show its extreme prices.
Understanding the Real Body and Candle Color
The real body is the thick rectangle connecting the opening and closing prices. A higher close creates a green or white candle and signals bullish momentum. A red or black candle closes lower, showing bearish pressure.
Interpreting Upper and Lower Wicks
Thin lines extending from the body are called wicks or shadows. They show prices reached beyond the opening and closing levels. They help identify market indecision or strong reversals in candlestick charts.
What a Long Upper Wick Says About Buyers and Sellers
A long upper wick shows buyers pushed prices higher, but sellers drove them back down. This often means strong resistance appeared at that level. It is a warning sign that upward momentum may be fading.
What a Long Lower Wick Says About Rejected Prices
A long lower wick shows sellers pushed prices down before buyers stepped in. This rejection often means support is holding firm. Traders may see this as a sign that the price action could move higher.
How to Read Candlestick Charts on Different Time Frames
Success in the stock market often depends on reading candlestick charts across different time frames. Choosing the right interval supports your technical analysis. It reveals both broad trends and small details in price action.
Choosing Time Frames for Market Context and Trade Entries
Traders often use higher time frames to find a stock’s overall direction. After the trend becomes clear, they switch to lower time frames for precise entries. This approach helps you avoid trades against the main momentum shown by your market analysis.
Using Daily and One-Hour Charts to Identify the Larger Trend
The daily chart shows long-term support and resistance levels clearly. Many professionals use the one-hour chart to confirm these levels before acting. This combination filters out noise from shorter time frames.
Using Five-Minute and One-Minute Charts for Day Trading Execution
When you execute a trade, five-minute and one-minute charts become useful tools. These intervals show the day’s immediate price action. They help you react quickly to changes in buying or selling pressure.
Why Multiple Time-Frame Analysis Reduces Conflicting Signals
Using several time frames helps prevent trades against the main trend. This gives your trading strategies a safety net. When a short-term signal matches the long-term trend, your chance of success rises.
How Candle Size Changes With Each Time Frame
A candle’s size reflects volatility during its specific period. A large candle on a one-minute chart may look tiny on a daily chart. Understanding this scale supports accurate technical analysis.
| Time Frame | Primary Use | Volatility Level |
|---|---|---|
| Daily | Market Context | Low |
| One-Hour | Trend Confirmation | Moderate |
| Five-Minute | Trade Execution | High |
| One-Minute | Scalping/Precision | Very High |
How to Read Candlestick Charts Step by Step

You can improve trading results with a consistent process for studying price action. A steady routine filters market noise and highlights high-probability setups. A clear sequence for technical analysis also reduces stress during quick decisions.
Step 1: Confirm the Stock, Session, and Chart Settings
Before studying data, check that your platform uses the correct settings. Confirm the ticker symbol and time frame match your strategy. Check session settings to avoid extended-hours data when your strategy uses regular market sessions.
Step 2: Identify the Current Trend and Market Structure
Study the larger picture to see whether the market trends or moves sideways. An uptrend has higher highs and higher lows, while a downtrend has lower highs and lower lows. This market analysis helps you choose the right trade direction.
Step 3: Mark Support, Resistance, and Key Price Levels
Draw horizontal lines at past swing highs and lows where price reacted. These areas often matter when reading candlestick charts, showing where buyers or sellers may enter. Marking these zones early helps you expect reversals or breakouts before they occur.
Step 4: Examine the Latest Candle in Context
After marking levels, study the newest candle and its response to each zone. A long wick at support may signal exhaustion, while a solid body near resistance suggests strong momentum. View the candle within surrounding price action, not alone.
Step 5: Wait for Confirmation Before Entering a Trade
Impulsive entries often hurt new traders. Instead, wait for a second signal, such as a follow-through candle or a break above a short-term trend line. This patience gives your technical analysis confirmation that the move has real intent.
Step 6: Define the Entry, Stop-Loss, and Profit Target
Before clicking buy or sell, create a clear plan. Place a stop-loss order just beyond logical support or resistance to protect your capital. Set a realistic profit target at the next major level, keeping a positive risk-to-reward ratio in your market analysis.
Recognize Common Bullish and Bearish Candlestick Patterns
Candlestick patterns show the ongoing struggle between buyers and sellers. These shapes help you read price action and judge market confidence or uncertainty. These Japanese candlesticks show supply and demand during a specific timeframe.
Single-Candle Patterns: Doji, Hammer, and Inverted Hammer
A Doji forms when opening and closing prices are nearly identical, showing market indecision. At a downtrend’s bottom, a Hammer suggests buyers rejected lower prices. An Inverted Hammer shows buyers lifted prices before a small retreat, suggesting possible bullish momentum.
Bearish Single-Candle Signals: Shooting Star and Hanging Man
After an uptrend, a Shooting Star has a long upper wick, showing sellers regained control. A Hanging Man looks like a Hammer but appears during an uptrend, warning that the rally may weaken. These chart patterns help traders spot possible reversals before they develop.
Two-Candle Patterns: Bullish and Bearish Engulfing Candles
An Engulfing pattern has two candles, and the second body fully covers the first. A Bullish Engulfing candle shows buyers overpowering sellers, while a Bearish Engulfing candle shows sellers taking charge. These signals often beat single-candle formations because they show a clear momentum shift.
Continuation Signals: Inside Bars and Marubozu Candles
Inside Bars show consolidation because the current candle stays within the previous candle’s range. A Marubozu candle has few or no wicks and shows strong conviction in one direction. Traders use these signals to confirm that the current trend will likely continue.
Why Candle Patterns Need Location and Context
Never trade these signals alone because their value depends greatly on where they appear. A pattern near major support or resistance carries more weight than one in the middle of a range. Always study the broader trend so your trade follows the market’s path of least resistance.
| Pattern Name | Type | Market Signal |
|---|---|---|
| Doji | Indecision | Potential Reversal |
| Hammer | Bullish | Support Rejection |
| Shooting Star | Bearish | Resistance Rejection |
| Engulfing | Reversal | Strong Momentum Shift |
Use Candlestick Patterns With Trend, Volume, and Support
Successful traders treat candlestick patterns as one part of a larger technical analysis puzzle. A shape may look promising, but its value depends on its setting. Visual signals alone can cause false entries in the fast-paced stock market.
Combining Candle Signals With Trend Direction
The strongest price action signals follow the market trend. A bullish reversal during a strong uptrend has a higher chance of success. Trading against the main trend often causes avoidable losses.
Find the major trend before studying specific chart patterns. When direction is clear, your trading strategies should favor that momentum. This step helps you trade with the move.
Confirming Breakouts With Trading Volume
Volume fuels major price moves. A breakout on low volume may be a trap because institutional buyers lack conviction. Look for rising volume to confirm a real breakout.
When a candle closes above resistance, check the volume bars below your chart. High volume shows active support for the new price level. This market analysis helps avoid “fake-outs” in low-liquidity settings.
Using Support and Resistance to Filter Weak Setups
Support and resistance set boundaries for trades. A pattern in a range’s middle may be noise, but one at a key level offers a stronger signal. Use these zones to reject weak setups without structural support.
Waiting for price to reach a proven level can improve your risk-to-reward ratio. This approach keeps you from chasing price. Instead, you wait for a logical reaction at a significant chart point.
Distinguishing a Reversal From a Temporary Pullback
You must know whether a move is a true reversal or a brief pause. A reversal often changes market structure, such as through a lower high or higher low. A pullback is usually a minor dip within an existing trend.
Watch for exhaustion signals, such as long wicks or failed attempts to break a level. If price cannot make a new high or low, the trend may be losing strength. Telling these scenarios apart is a core skill in professional market analysis.
How Premarket Gaps and the Opening Range Affect Candle Interpretation
The first minutes of the trading day can be volatile and unpredictable. Premarket gaps may change the whole landscape and make earlier support levels irrelevant. Watch the opening range to find real supply and demand.
Wait for the market to form a clear range before entering a trade based on one candle. The opening range often sets the session’s tone. Patience lets the stock market reveal its true intent for the day.
Apply Candlesticks to Practical Day Trading Strategies
Turn theory into real results by using proven trading strategies in your daily routine. Focus on market conditions, not simple observation, and make informed decisions from reliable price action.
Trading a Bullish Reversal at Support
A bullish reversal often starts when price reaches a historical floor. Look for a hammer or bullish engulfing candle showing buyers defending that level.
Trading a Bearish Reversal at Resistance
When the market reaches a ceiling, watch for signs of exhaustion. A shooting star or bearish engulfing pattern at resistance suggests sellers are regaining control of the price action.
Using Breakout-and-Retest Candles
Breakouts can excite traders, but they often become traps. Let price break a level, then watch for a retest. Rejection of the old resistance confirms new support.
Following Pullbacks During Strong Intraday Trends
In a strong trend, do not chase the move. Wait for a pullback to a moving average or previous breakout point, then seek a continuation candle for the next leg up.
Entry, Stop-Loss, and Profit-Target Examples for Each Setup
Consistency matters when you manage trades. Use this table to structure positions with common chart patterns.
| Setup Type | Entry Trigger | Stop-Loss Placement | Profit Target |
|---|---|---|---|
| Bullish Reversal | Break of candle high | Below the wick low | Next resistance level |
| Bearish Reversal | Break of candle low | Above the wick high | Next support level |
| Breakout-Retest | Bounce off level | Below the retest low | Recent swing high |
When to Avoid a Pattern Despite a Visually Attractive Candle
Not every attractive candle gives a tradable signal. Avoid candlestick patterns when volume is low; this suggests little institutional interest. If the risk-to-reward ratio is poor, staying out is often better.
Always consider the broader context of your chart patterns. During consolidation or thin liquidity, even a perfect candle can fail to create a profitable move.
Manage Risk Before Acting on a Candle Signal

Even accurate market analysis cannot guarantee a winning trade every time. Candlestick patterns offer clues, but they show probabilities, not certainties. Protect your capital to survive in the stock market over the long term.
Set a Maximum Per-Trade and Per-Day Loss
Professional traders never risk their entire account on one setup. Set a dollar amount or percentage of total capital you can lose on each trade.
- Limit per-trade risk to 1% or 2% of your total account balance.
- Establish a daily loss limit to prevent emotional over-trading.
- Stop trading immediately once your daily limit is reached to preserve your mental clarity.
Place Stop-Loss Orders Beyond Invalidated Price Levels
A stop-loss order helps defend against unexpected price swings. Place it where your original trade idea is no longer valid.
For example, after entering on a bullish hammer at support, place your stop just below that candle’s low. If price breaks that level, the pattern failed, so exit to limit further damage.
Calculate Position Size From Entry and Stop Distance
Set your position size using the distance between your entry price and stop-loss level. This keeps your dollar risk constant, whether your stop is wide or tight.
Use this simple formula to calculate your shares:
- Determine your total dollar risk for the trade.
- Calculate the distance between your entry and your stop-loss.
- Divide your total dollar risk by the stop distance to find the number of shares to buy.
Evaluate Risk-to-Reward Before Opening a Position
Before committing capital, compare potential profit with potential loss. Effective trading strategies seek a favorable ratio, usually at least 2:1 or 3:1.
| Metric | Conservative | Aggressive |
|---|---|---|
| Risk-to-Reward | 1:2 | 1:3 |
| Win Rate Needed | Above 35% | Above 25% |
| Trade Quality | High | Very High |
Why a High-Probability Pattern Can Still Lose
Even reliable patterns can fail after sudden news or changes in institutional flow. Markets are unpredictable, and a high-probability setup has only worked more often in the past. Always accept that the market may move against your position.
Warnings About Leverage, Margin, Short Selling, and Volatility
Leverage or margin can greatly increase losses, turning a small mistake into a major account drawdown. Short selling has special risks, including unlimited losses if a stock price rises unexpectedly. High volatility can trigger stop-loss orders early or cause major slippage during fast-moving sessions.
Avoid Common Candlestick Chart Reading Mistakes
Good trading requires you to avoid mistakes that cause needless losses. Even experienced traders can misread price action and fall into costly traps. Spotting these errors early helps protect your money and improve your decisions.
Trading Every Doji or Reversal Pattern in Isolation
Treating each candle as a guaranteed signal is a common mistake. In markets, Context is everything. A reversal signal during a strong trend may create noise, not a true turning point.
Entering Before a Candle Closes
Many traders enter while a candle still forms. Price can shift sharply during the final seconds. Wait for the candle to close before trusting the candlestick patterns you see.
Confusing a Wick With a Confirmed Breakout
A long wick often shows rejection, not a breakout. A price spike above resistance with a long tail may show market resistance. Do not mistake a brief probe for a lasting move.
Ignoring Volume, Liquidity, Spreads, and Slippage
Successful trading requires more than reading chart patterns. Check whether enough volume supports your trade. Wide spreads and slippage can turn a winning setup into a loss.
Changing Time Frames to Justify a Losing Trade
Consistency matters for long-term success. If you enter using a five-minute chart, do not switch to a one-hour chart to defend a losing trade. Follow your original plan and timeframe.
Overloading a Chart With Indicators and Patterns
Too many indicators can cause “analysis paralysis.” Keep your workspace clean and focus on the raw data. Extra chart patterns or overlays can hide important signals.
| Common Mistake | Resulting Risk | Corrective Action |
|---|---|---|
| Trading in isolation | False signals | Use trend context |
| Early entry | Premature stop-outs | Wait for candle close |
| Ignoring volume | Poor execution | Check liquidity levels |
| Indicator overload | Confused analysis | Simplify your workspace |
Choose Charting Platforms and Build a Trading Workspace
Your trading workspace is the command center for all your market analysis work. An organized setup helps you react quickly to price changes and stay focused on your strategy. The right tools can simplify your technical analysis and improve consistency in the stock market.
Using TradingView for Candlestick Analysis and Replay Practice
TradingView is popular because it offers an intuitive interface and powerful visualization tools. Its replay feature helps traders study historical price action with ease.
TradingView’s Official Website, Chart Tools, Alerts, Plans, and Variable Subscription Pricing
Its official website offers many drawing tools and indicators. Flexible subscription tiers help you choose a plan for your needs. Check the site for current pricing, then create alerts for reached price levels.
Using Charles Schwab thinkorswim for Charts, Paper Trading, and Order Entry
thinkorswim suits traders who need strong tools for research and trade execution. It links charts with your brokerage account, making real-time trade management easier.
thinkorswim Web, Desktop, and Mobile Access, Account Requirements, and Brokerage Support
The platform offers a consistent experience on desktop, web, and mobile devices. Its paper trading feature lets you test strategies without risking real capital. Review current account requirements and support options on the official Charles Schwab website first.
Comparing Webull and Interactive Brokers Trader Workstation
Your trading style and preferred tools often guide your broker choice. Webull has a user-friendly mobile interface, while Interactive Brokers offers Trader Workstation for advanced users.
Differences in Market Data, Commissions, Margin, Customer Support, and Platform Tools
- Market Data: Compare the cost and depth of real-time data feeds.
- Commissions: Review the fee structure for different asset classes.
- Platform Tools: Evaluate which interface best supports your market analysis workflow.
Security and Regulatory Checks Before Funding a Brokerage Account
Before depositing funds, confirm that your broker follows strong security standards. Protecting your capital matters as much as your technical analysis skills.
Checking SIPC Coverage, Two-Factor Authentication, FINRA Registration, and Current Fee Schedules
Verify that your broker is registered with FINRA and provides SIPC coverage. Enable two-factor authentication to add security to your login. Read current fee schedules to avoid unexpected costs while navigating the stock market.
Practice, Review, and Improve Your Candlestick Decisions
Consistent trading takes deliberate practice and honest self-reflection. You cannot master candlestick charts overnight, but treating trading like a professional business can speed your progress. Use measurable data, and your intuition can become a reliable edge.
Use Paper Trading and Historical Chart Replay
Before risking your hard-earned capital, use paper trading to test your trading strategies without financial risk. Most modern platforms offer replay features that let you review historical data one candle at a time. This practice helps you spot candlestick patterns in real time without live market pressure.
Keep a Journal With Screenshots and Trade Reasoning
A detailed trading journal is one of your most powerful tools. Whenever you enter a trade, capture the setup in a screenshot and record your exact reasoning. This record shows whether you followed your technical analysis or acted on a gut feeling.
Track Pattern Performance by Market Condition
Not all chart patterns perform the same way in every market environment. Group trades by market condition: trending, ranging, or high volatility. This approach reveals which setups have the highest chance of success in each condition.
Review Win Rate, Average Loss, Average Gain, and Maximum Drawdown
Numbers do not lie, and they support long-term growth. Regularly calculate your win rate, then compare average gains with average losses. This check helps keep your risk-to-reward ratio healthy. Track maximum drawdown too, because it shows how much capital you might risk during a losing streak.
How to Turn Repeated Mistakes Into Specific Trading Rules
When you spot a recurring error, write a clear rule to prevent it. For example, if you enter trades too early, require a confirmed candle close before clicking the buy button. Over time, these written rules can build a disciplined and profitable trading system.
Our Conclusion
Successful trading requires patience, discipline, and a deep understanding of market dynamics. Mastering candlestick charts gives you a visual language that turns raw data into actionable insights about buyer and seller behavior.
Effective market analysis depends on combining price action with volume and key support levels. This structured approach helps filter market noise and focus on high-probability setups aligned with your goals.
Remember, technical analysis supports decisions rather than acting as a crystal ball. No single pattern guarantees profit, making responsible risk management the most vital part of your strategy.
Platforms like TradingView or Charles Schwab thinkorswim provide an environment for refining these skills through consistent practice. Keep a detailed trade journal to track progress and identify areas for improvement over time.
Stay committed to your education and maintain a disciplined mindset while navigating markets. Your growth as a trader depends on learning from every session and adapting confidently to changing conditions.
Our FAQs
What exactly are Japanese candlesticks and how do they differ from regular line charts?
A simple line chart tracks only closing prices. Japanese candlesticks show open, high, low, and close (OHLC) for each period. Line charts give a “smoothed” stock market view, but candlesticks show the struggle between buyers and sellers. This makes them essential for in-depth technical analysis.
Can I rely on candlestick patterns alone to make profitable trades?
No single signal guarantees a profit. Hammer and engulfing candle patterns offer clues, but work best within broader trading strategies. Professional traders confirm setups with volume, support and resistance levels, and the overall trend.
Why is the “time frame” so important when reading chart patterns?
The meaning of a candle changes with its interval. A doji on a daily chart might signal a major trend reversal. The same pattern on a one-minute chart might show a brief moment of low liquidity. Many traders use higher time frames for context, then lower ones, including TradingView’s five-minute chart, for precise execution.
What are the most common chart patterns beginners should look for?
Beginners often identify high-conviction signals, such as bullish and bearish engulfing candles, showing a clear shift in control. Other vital chart patterns include the shooting star, indicating price rejection, and the inside bar, signaling consolidation. Learning these patterns helps explain the stock market’s psychological state at any moment.
How do I manage risk when I see an attractive candlestick setup?
Risk management is the most critical part of technical analysis. Before entering a price-action trade, define your stop-loss, usually just beyond the signal candle’s wick, and calculate position size. Platforms like Charles Schwab thinkorswim let you set these parameters automatically, so you never lose more than your predetermined limit.
Is it a mistake to trade a candle before it officially closes?
Yes, this is a common pitfall. A strong Marubozu, with a large body and no wicks, can change shape during the period’s final seconds. Waiting for the candle to close confirms the technical analysis signal and prevents reactions to temporary price fluctuations.
Which platforms are best for practicing these trading strategies without risking real money?
For beginners, paper trading is a great way to build confidence. Webull and Interactive Brokers offer robust demo accounts. TradingView’s “Bar Replay” feature lets you identify japanese candlesticks on historical data. This helps you refine trading strategies without financial risk.
Why does volume matter when I am looking at candlestick charts?
Trading volume validates price action. For example, a bullish breakout candle with high volume suggests strong participation from institutional buyers. Without volume, even perfect-looking candlestick patterns may lack the conviction needed to sustain a stock market move.
Explore Our Exciting Related Products and Services