
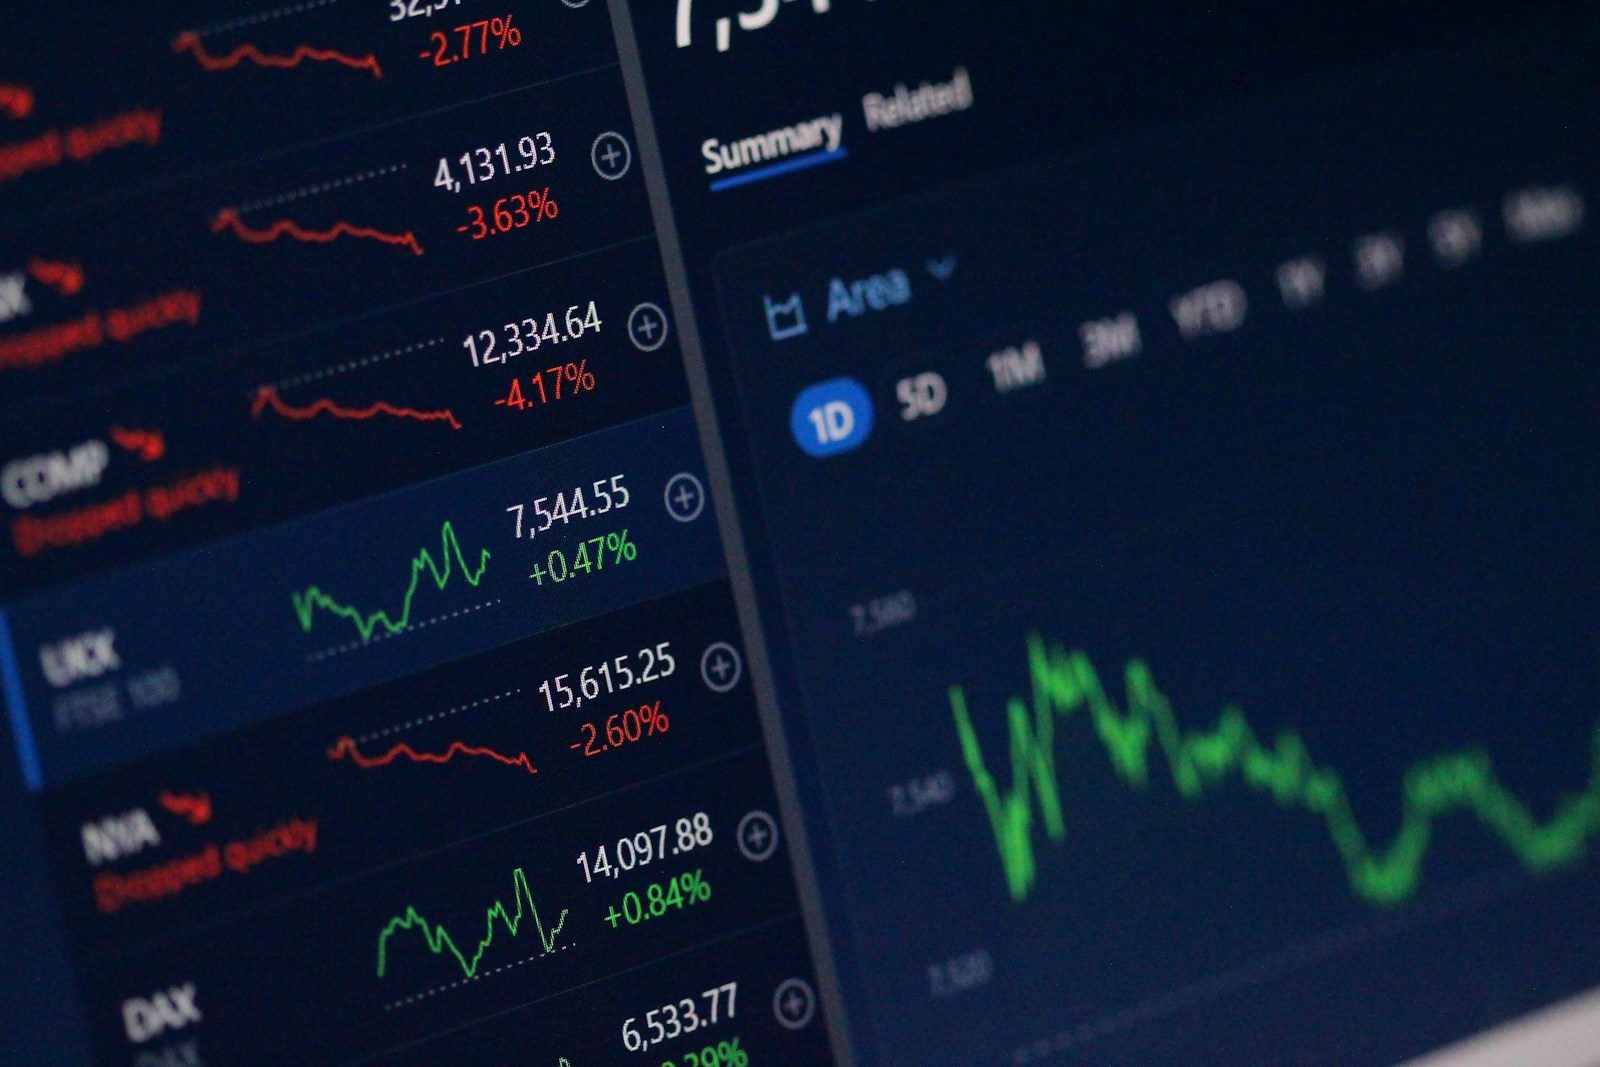
Over 80% of active market participants fail to stay profitable during their first year. Success in day trading takes precision, discipline, and digital tools that help manage risk. Many professionals use advanced software to study price action and plan trades. This platform supports market analysis with real-time charts, custom indicators, and automated alerts.
Remember, it is a visual aid, not a replacement for your regulated brokerage account. In this comprehensive tradingview tutorial, we explain a professional TradingView setup. You will configure your workspace, manage alerts, and build repeatable routines. Learning trading on tradingview can bring clarity when you navigate volatile markets with confidence and control.
Why Trading on Tradingview Matters for Day Traders
Trading on Tradingview gives modern day traders both power and simplicity. This day trading platform combines advanced charts, real-time market data, and social collaboration.
What Tradingview is and how it supports active trading
At its core, the Tradingview platform is a cloud-based hub for market research. It offers fast charts, technical indicators, and fundamental data for tracking global assets. News feeds and economic calendars support detailed Tradingview analysis in one workspace.
The service supports an active intraday workflow. You can monitor forex pairs and volatile stocks while viewing price action clearly. Simulation features let you test ideas before risking real capital.
What readers will learn about charts, indicators, alerts, brokers, and risk controls
This guide shows you how to build a professional-grade environment. It covers the key steps for making your workspace efficient. You will learn how to:
- Customize charts to highlight key price levels.
- Apply indicators that provide actionable signals.
- Set up automated alerts to catch market moves.
- Connect your broker for seamless order execution.
- Implement strict risk controls to protect your account.
Why a deliberate setup can reduce execution mistakes and information overload
Many traders fail when they react to market noise instead of following a plan. A deliberate setup on the Tradingview platform filters distractions and keeps your strategy in focus. Organized watchlists and layouts reduce impulsive, emotional decisions.
With your tools ready, you can execute trades with confidence. This preparation reduces mental fatigue, which can cause costly errors during high-volatility sessions.
Important distinction between Tradingview’s analysis platform and a brokerage account
Tradingview is mainly an analysis tool. You can connect a broker to execute trades, but Tradingview does not hold funds or settle transactions. The table below shows differences between these two important parts of your trading business.
| Feature | Tradingview Analysis | Brokerage Account |
|---|---|---|
| Primary Role | Charting & Strategy | Order Execution & Custody |
| Data Handling | Visualizing Market Trends | Managing Trade Settlement |
| Risk Management | Planning & Alerting | Margin & Regulatory Compliance |
| Access | Cloud-based Interface | Secure Financial Gateway |
Create the Right Tradingview Account and Workspace
Building a reliable foundation on the tradingview platform helps every day trader. An organized workspace helps you react quickly to market moves without distractions. This tradingview tutorial explains the first setup steps for live trading.
Open an account through the official Tradingview website
Visit the official website and register with a valid email address. Use a secure, private email that you check often for important notifications. After verification, you can access the basic features of your new TradingView account.
Compare Basic, Essential, Plus, and Premium membership options
Choose the right TradingView membership based on your trading needs and required indicators. Entry-level plans suit beginners, while active day traders may need advanced features.
| Plan Type | Chart Capacity | Alerts | Data Speed |
|---|---|---|---|
| Basic | 1 Chart | Limited | Standard |
| Essential | 5 Charts | Increased | Fast |
| Plus | 10 Charts | High | Real-time |
| Premium | 25 Charts | Unlimited | Ultra-fast |
Free-plan capabilities, limitations, and whether a free trial is available
Use the free plan to test the interface and basic charting tools. It limits saved layouts and indicator slots. A free trial may let you test premium features before choosing a paid TradingView membership.
How to verify current U.S. prices, taxes, billing terms, and renewal conditions
Check the official billing page for current pricing in your region. Prices may change because of local taxes and promotions. Review renewal terms and the cancellation policy in your TradingView account settings to avoid unexpected charges.
Choose a username, secure the account, and enable two-factor authentication
Choose a professional username that hides sensitive personal information. Use a strong, unique password that you do not use elsewhere. Enable two-factor authentication (2FA) to protect against unauthorized access.
Set the chart timezone, market session, currency, and regional preferences
After securing your account, open chart settings and set your regional preferences. Set your timezone to match local market hours, so candles match opening and closing bells. Adjust currency and session settings to keep technical analysis accurate for your trading strategy.
Choose a Day-Trading Market and Build a Watchlist
A solid foundation starts with a market that fits your strategy. Effective market selection means considering liquidity, volatility, and active trading hours.
Select stocks, ETFs, futures, forex, or cryptocurrency based on a defined strategy
Whether you prefer the fast pace of stock day trading or forex’s global reach, match your choice with capital and risk tolerance. Each asset class behaves differently. Choose instruments with enough movement for your profit targets and tight spreads.
Search Tradingview symbols accurately and identify the correct exchange listing
A ticker may appear on several exchanges. It is crucial to choose the correct exchange, so your analysis shows the venue’s true liquidity and price action. This choice should match where you plan to trade.
Create watchlists for premarket candidates, opening-range setups, and liquid instruments
A well-organized TradingView watchlist acts as your command center during each session. Separate premarket movers from liquid stocks or ETFs you track daily.
Use volume, average daily range, spread, price, and float as screening criteria
To narrow your focus, apply filters to your scan. Consider these metrics when building your list:
- Volume: Ensures there is enough interest to enter and exit positions easily.
- Average Daily Range: Helps identify stocks with enough volatility for intraday moves.
- Float: Lower float stocks often exhibit more aggressive price swings.
- Spread: Keeps your transaction costs low by avoiding illiquid assets.
Customize watchlist columns for last price, percentage change, volume, and volatility
Add columns for instant feedback on market conditions. Seeing percentage change beside current volume helps you spot momentum shifts instantly without opening every chart.
Check real-time versus delayed market data and exchange-data requirements
Reliable real-time market data is essential for active traders. Subscribe to the required exchange data feeds in your account settings. Default quotes are often delayed by 15 minutes, and can cause poor execution and unnecessary losses in fast markets.
Configure Tradingview Charts for Fast, Clear Analysis

A cluttered screen can slow quick, profitable trading decisions. Streamline your workspace to focus on price action, not visual noise. Tradingview charts help you build a professional setup for your strategy.
Pick a chart type and select practical intraday timeframes
Choosing the right timeframes helps you follow the market’s rhythm. Most active traders use several views for balanced analysis.
Use one-minute, five-minute, fifteen-minute, and daily charts together
Using intraday charts at several intervals shows the big picture and supports precise entries. The daily chart shows the main trend, while fifteen-minute and five-minute views reveal momentum shifts. Use the one-minute chart to refine execution after confirming a setup.
Understand candlesticks, regular trading hours, premarket, and after-hours data
Most traders prefer candlestick charts because they show buyer and seller activity during each period. Toggle settings to include premarket and after-hours data. This reveals key price levels formed before the opening bell.
Apply a clean chart layout with readable colors, scales, and price labels
Your layout should be instantly readable under pressure. Use high-contrast candle colors and keep price scales clear. Avoid too many tradingview indicators that hide price movement.
Mark support, resistance, premarket high and low, previous close, and volume levels
Marking key levels is essential to a successful trading routine. Always mark the previous day’s close and the premarket high and low. These areas often attract price action during the session’s first hour.
Use multiple-chart layouts without creating conflicting signals
Arrange your screen to show several timeframes at once. This reduces tab switching and saves seconds during volatile moves.
Assign higher-timeframe context, setup confirmation, and entry-execution charts
Give each window a specific role to keep your analysis organized. For example, place the daily chart left for context and the one-minute chart right for execution. This setup helps prevent conflicting signals between long-term and short-term goals.
Save layouts, chart templates, and symbol-specific drawings
Save any setup that works as a template. Then apply your preferred settings to any new symbol instantly. Saving drawings keeps your analysis consistent across trading sessions.
| Timeframe | Primary Use | Trading Goal |
|---|---|---|
| Daily | Trend Analysis | Identify major support and resistance |
| 15-Minute | Momentum Tracking | Spot early session breakouts |
| 5-Minute | Setup Confirmation | Validate entry triggers |
| 1-Minute | Execution | Refine stop-loss and entry points |
Install Tradingview Indicators for Day-Trading Analysis
Building a clean, useful workspace helps you make fast, informed decisions. When performing tradingview analysis, filter market noise instead of adding to it. A simple setup helps you focus on raw price movement and profit potential.
Start with price action, volume, and simple moving averages
Start with the price itself. Clean candles and volume give you a clearer view of market sentiment. These core elements provide reliable data for your daily routine.
Use VWAP to evaluate intraday value and trend context
The VWAP indicator shows the average price weighted by volume. It helps you see whether the market trades at a premium or discount during the day’s activity. Always watch price action around this line to gauge institutional interest.
Use the 9-period and 20-period exponential moving averages carefully
These averages act as moving support and resistance during strong trends. Use them to spot momentum shifts, but avoid them in choppy, sideways markets. They provide context, not magic entry signals.
Read volume, relative volume, and volume-weighted signals
Volume confirms the strength behind a price move. High volume at key levels suggests a breakout or reversal may hold. Compare current volume with historical averages to spot unusual activity.
Add RSI, MACD, ATR, or Bollinger Bands only when they answer a specific question
Many tradingview indicators are available, but too many create information overload. Add a tool only when it solves a clear problem, such as measuring volatility or overextended conditions. Remove any indicator that offers no useful insight.
Recognize lagging signals, overlapping indicators, and confirmation bias
Most indicators use past price data, so they lag behind the current market. Tools that measure the same thing create repeated signals. Watch for confirmation bias, which supports only your existing trade idea.
Configure indicator inputs, colors, visibility, and alert conditions
Customization is a powerful platform feature. Adjust inputs to match your timeframe and strategy. Use clear colors and visibility rules to keep the chart readable.
Test indicator combinations on historical charts before using them live
Before risking real capital, use replay to review how your tools performed in the past. This shows how your setup handles different market conditions. Historical testing builds confidence and reveals strategy limits.
Compare indicator signals with price structure instead of treating them as predictions
Indicators are not crystal balls. Use them to validate price structure, not predict future moves. Always prioritize actual price action over signals from a script.
Keep the final chart uncluttered enough for rapid decisions
A cluttered chart slows fast execution. You should scan the screen and identify your setup within seconds. If candles are hard to see, simplify your layout.
| Indicator | Primary Use | Best For |
|---|---|---|
| VWAP | Intraday Value | Trend Identification |
| 9/20 EMA | Momentum | Dynamic Support |
| ATR | Volatility | Stop Placement |
| RSI | Momentum | Overbought/Oversold |
By following these day-trading indicators guidelines, you create a professional space for consistent decisions. Keep your tools sharp, charts clean, and focus on price.
Use Tradingview Strategies, Scripts, and Signals Responsibly
TradingView offers many community tools, so review each one carefully and stay skeptical. Its native tools are robust, but traders often seek custom solutions for a market edge.
Distinguish built-in indicators from community-created Tradingview scripts
Built-in indicators are developed and maintained by the platform’s internal team. These tools undergo rigorous testing for stability and accuracy. In contrast, tradingview scripts are often created by community members.
These community tools can be innovative, but they lack the same official oversight. Verify each custom code source and purpose before adding it to your workspace.
Search the public library for strategies and evaluate author claims
The public library offers many ideas, but not every tool suits live market conditions. Review each resource critically to help protect your capital.
Check script descriptions, update history, source visibility, and user comments
Read the author’s description carefully, and look for a clear explanation of the code’s logic. Check the update history to see whether the author maintains the script. If the source code is visible, inspect its logic and confirm that it fits your trading style.
Understand Pine Script strategies, backtesting, and commission assumptions
Pine Script strategies let users automate backtests with historical data. These tests may use ideal assumptions that do not reflect reality. Review commission and capital allocation settings every time.
Account for slippage, spread, liquidity, order fills, and look-ahead bias
Most backtests ignore real-world friction. Slippage and wide spreads can turn a profitable backtest into a losing live strategy. Watch for look-ahead bias, when a script uses future data to predict past events, creating an unrealistic performance record.
Use alerts and signals as parts of a process rather than automatic trade instructions
Effective tradingview signals should provide secondary confirmation, not the main trigger. Relying only on automated alerts can cause poor decisions during volatile market sessions. Treat these signals as part of a broader, human-led process.
Paper-trade a strategy before connecting it to real money
Never skip testing. A paper-trading account shows how tradingview strategies perform in real time without risking your funds.
Record entry rules, exits, invalidation points, and results in a trading journal
Keep a detailed performance log to identify patterns. Your journal should include the following elements:
- Specific entry and exit criteria.
- Defined invalidation points for every trade.
- A summary of results to track your progress over time.
Documenting your journey turns raw data into useful insights. This disciplined approach is a hallmark of a professional trader.
Set Up Alerts for Entries, Exits, and Market Conditions
Alerts help traders find opportunities without watching screens all day. Automated monitoring warns you when markets reach your planned levels.
Create price alerts at planned breakout, support, resistance, and stop levels
The main tool is price alerts, which you can place directly on a chart. Right-click a price level to get a notice when the asset reaches it.
Use them to track breakouts or test support and resistance zones. Advance markers reduce manual watching during volatile sessions.
Configure indicator, drawing, watchlist, and strategy alerts
You can create triggers with tradingview indicators and custom drawings. Set an alert when price crosses a trendline or channel.
You can add tradingview signals from your favorite strategies. These triggers support technical analysis across several assets without overwhelming you.
Choose once-only, every-time, or recurring alert behavior appropriately
Choose alert behavior that fits your strategy. A once-only alert suits one entry, while every-time tracks repeated volatility near support.
Select pop-up, email, mobile push, or webhook notifications
The platform offers several ways to receive updates. Choose browser pop-ups, email, or mobile push alerts, wherever you are.
Webhooks can send data to external systems for automatic processing. Set up your mobile app correctly to receive push notifications in real time.
Review plan-based alert limits, expiration dates, and notification reliability
Your subscription tier sets how many active TradingView alerts you can keep. Check your account limits so important triggers do not expire unexpectedly.
Write alert messages that include the symbol, timeframe, trigger, and required action
An alert helps only when its message tells you what to do. Include the ticker symbol, timeframe, trigger, and planned action.
For example, writing “XYZ – 5m – Breakout above $50 – Prepare to buy” provides immediate clarity. This proactive approach reduces hesitation during fast-moving market conditions.
Test alerts before the trading session and avoid duplicate notifications
Before trading begins, check that your triggers work and remain active. Testing helps prevent missed trades caused by bad settings or silent notifications.
Never assume an alert guarantees an order fill or a profitable move
An alert only reports that a condition occurred. It cannot guarantee an order fill or a profitable move. Use alerts with your broader decisions, not instead of your judgment.
Connect a Broker and Understand Tradingview Order Execution

Trading on TradingView becomes more useful when you connect a live brokerage account to your charts. This link lets you manage positions without leaving your workspace, making trading more efficient.
Review supported Tradingview broker integrations in the United States
The platform supports several trusted brokers through direct broker integration. Linking your account lets you send orders from the chart interface.
Compare available connections such as Interactive Brokers, TradeStation, and OANDA
Each broker offers different benefits based on your asset class. Interactive Brokers offers broad market access, while TradeStation and OANDA specialize in equities and forex, respectively.
Open and fund a separate brokerage account that meets the broker’s requirements
Before trading, you need a funded account with your chosen provider. TradingView provides the interface, while your main relationship remains with the brokerage firm.
Check minimum deposits, margin rules, options permissions, futures requirements, and pattern-day-trader rules
Check each account’s rules before you begin. Pattern-day-trader rules and margin requirements vary by firm, so choose an account that fits your trading frequency.
Connect the broker through Trading Panel and verify the correct account
Open the Trading Panel at the bottom of your screen to link your account. Choose your broker, then follow the secure login prompts.
Practice market, limit, stop, stop-limit, bracket, and closing orders in simulation mode
Use paper trading before risking real money. This simulation mode helps you test order speed and accuracy.
Confirm quantity, order direction, time in force, stop price, and profit target
Check every setting before pressing the buy or sell button. Precision is vital when managing risk with complex orders, such as brackets.
Understand that Tradingview does not replace the broker’s order-routing and execution systems
Remember that TradingView order execution relies on your broker’s backend. TradingView sends your instructions, but the broker routes and clears your trades.
Review brokerage commissions, regulatory fees, exchange fees, data fees, and margin interest separately
Your broker charges fees separately from your platform subscription. Review its fee schedule for commissions and data costs to avoid surprises.
Disconnect broker access and protect credentials on shared or public devices
Protect your account by logging out when you finish. Never save brokerage credentials on public computers, so your funds stay safer.
Build Risk Controls Before Placing a Day Trade
Successful day trading needs disciplined day-trading risk management before the market opens. Treat your trading capital as a business asset that needs constant protection. Without a clear plan, emotional choices can quickly reduce your account balance.
Define maximum risk per trade, daily loss, and total exposure in advance
Before entering any position, decide exactly how much you can lose. Most professionals risk 1% or less of their total account per trade. Set a hard daily loss limit to prevent revenge trading after a bad morning.
Calculate position size from the entry price, stop price, and dollar risk
Effective position sizing supports long-term trading survival. Use your entry price and planned exit to calculate the exact number of shares or contracts. If your stop is hit, you lose only the dollar amount you chose.
Use Tradingview’s long-position and short-position tools to model risk-to-reward
Tradingview provides built-in drawing tools to show trade details. Drag entry and exit levels on the chart to compare potential profit and loss. Always check these numbers before placing your order and confirm the reward justifies the risk.
Place stops at logical invalidation levels instead of arbitrary percentages
Avoid random percentage stops because they may ignore market structure. Place your stop-loss orders at logical points where your trade thesis fails, such as below key support. This approach grounds stops in price action instead of guesswork.
Set daily rules for maximum trades, consecutive losses, leverage, and revenge trading
Set strict rules to guide your behavior during each trading session. After a certain number of consecutive losses, leave the screen and clear your head. Limit leverage because excessive margin can turn a small mistake into a major financial loss.
Use alerts, brackets, and broker-side protective orders where available
Use technology to enforce your discipline automatically. Set tradingview signals to alert you when price nears your stop or target. When possible, use bracket orders that place stop-loss and take-profit orders as soon as your entry fills.
Understand gaps, halts, fast markets, slippage, and the limits of stop orders
Stop orders do not guarantee your exact price during high volatility. During a fast market or gap, your order may fill far below expectations. This slippage is part of trading and belongs in your risk model.
| Risk Factor | Mitigation Strategy | Impact Level |
|---|---|---|
| Market Gaps | Avoid holding overnight | High |
| Slippage | Use limit orders | Medium |
| Emotional Trading | Strict daily loss limits | Critical |
Review U.S. day-trading rules, margin disclosures, and tax-record requirements
If you trade in the United States, learn the Pattern Day Trader (PDT) rule and margin requirements. Keep detailed tax records of every trade for your annual filings. Consult a professional accountant about your strategy’s tax effects.
Explain that Tradingview is not a financial adviser and that trading can result in substantial losses
Tradingview is a charting platform, not a financial advisor. Its tools provide information and do not guarantee success. Trading involves substantial risk, so never trade money you cannot afford to lose entirely.
Save a Repeatable Pre-Market and Live-Trading Routine
A repeatable routine turns trading from a guessing game into a professional process. A structured pre-market trading routine reduces emotional decisions during fast market sessions. It helps you stay objective while navigating complex financial markets.
Prepare the workspace before the U.S. market opens
Success begins before the opening bell. Set up your tradingview charts with only data that supports your strategy. A clean workspace limits overload and keeps your focus on useful price action.
Review economic events, earnings, news, futures, market breadth, and unusual volume
Check the economic calendar for high-impact news that could trigger volatility. Review earnings reports and sector news to find potential movers. Analyze market breadth and futures to gauge sentiment across the broader indices.
Mark premarket levels and write bullish, bearish, and no-trade scenarios
Before the market opens, mark key support and resistance levels from premarket highs and lows. Write specific plans for bullish, bearish, and no-trade market conditions. A “no-trade” scenario matters as much as an entry plan because it prevents forced trades without a clear trend.
Use a trade checklist before submitting any order
A written checklist is a final gatekeeper for your capital. Before submitting an order, verify that the trade meets every strategy requirement. This habit prevents impulsive decisions and keeps risk management on track.
Confirm setup, timeframe, entry, stop, target, position size, and risk amount
Ensure your setup matches your chosen timeframe and your entry point makes sense. Confirm that your stop-loss and profit targets are clearly defined. Most importantly, confirm that your position size stays within your maximum risk per trade.
Monitor open positions without changing rules impulsively
After entering a trade, trust the plan you made during preparation. Do not move stops or exit early because of minor price changes. Discipline connects a good strategy with consistent results.
Use replay mode and paper trading to rehearse Tradingview strategies
Use a tradingview tutorial and the platform’s replay feature to study past market movements. Practice your tradingview strategies with paper trading in a risk-free environment. This rehearsal builds muscle memory for fast, accurate order execution.
Document screenshots, alerts, executions, mistakes, and performance metrics after the session
At the end of the trading day, review your actions and results. Save screenshots, alerts, execution logs, and performance metrics after the session. Review them for mistakes or plan breaks, then record your findings in a detailed journal.
| Phase | Primary Task | Goal |
|---|---|---|
| Pre-Market | News & Level Marking | Identify Opportunities |
| Execution | Checklist Verification | Maintain Discipline |
| Post-Market | Journaling & Review | Continuous Improvement |
Tradingview Features, Support, Security, and Practical Limitations
Using the tradingview platform well requires a clear view of its tools and services. Understanding the company can help you build a stronger trading routine.
Review Tradingview’s company, platform, and official resources
Tradingview’s official website, charting products, mobile apps, desktop app, and web platform
You can use TradingView through one web interface, a desktop app, and mobile apps for iOS and Android. These tools sync charts and watchlists across devices for a smooth experience.
Company background, New York business presence, and its role as a charting and social-analysis platform
TradingView is a global technology company with a major business presence in New York. It supports social-analysis, helping traders share ideas and technical setups. This connects data visualization with community collaboration.
Find help through the Tradingview Help Center, support tickets, email options, and community resources
Explain that Tradingview does not prominently publish a general customer-service telephone number and that support availability may vary
For technical issues, the main TradingView support channel is the online Help Center. The company does not prominently publish a general customer-service telephone number for immediate voice help. Digital tickets and email track questions for the right technical teams.
Evaluate account security, two-factor authentication, login alerts, and broker-connection precautions
Strong TradingView security is essential for every active trader. Enable two-factor authentication (2FA) to guard your account against unauthorized access. Keep login alerts active, and use care when connecting your brokerage account on public or shared devices.
Understand platform limitations, including data delays, outages, repainting scripts, and broker availability
The platform is powerful, but it has limits. Data delays may occur based on your subscription, and extreme market volatility can cause temporary outages. Also, watch for tradingview scripts that repaint, because they can change historical data and create misleading signals.
Clarify regulation, privacy, subscriptions, refunds, and third-party broker responsibilities
Tradingview is not itself the custodian or regulator of a user’s brokerage funds
TradingView is a charting and analysis interface, not a financial institution. It does not hold or regulate your brokerage funds; your chosen third-party broker handles those duties. Review the privacy policy and subscription terms to understand refund rights and data handling.
Identify who benefits most from Tradingview and who may need a specialized platform
Most retail day traders find the platform meets their needs because it is versatile and easy to use. High-frequency traders and users who need institutional-grade order routing may need a specialized, direct-access trading platform.
| Feature Category | TradingView Capability | Best For |
|---|---|---|
| Charting | Advanced & Interactive | Technical Analysis |
| Support | Digital Tickets | Non-Urgent Queries |
| Security | 2FA & Alerts | Account Protection |
| Execution | Broker Integration | Retail Day Trading |
Our Conclusion
Building a strong TradingView day-trading setup takes more than clicking buttons. It requires disciplined risk management and a clear understanding of your trading goals. Technical skill and sound judgment create a foundation for steady market participation.
Effective trading on TradingView means filtering noise and focusing on useful data. The platform offers powerful tools, but success depends on applying them to your strategy. Verify broker connections and track realistic market costs to protect your capital.
Improving your tradingview analysis takes time and regular practice. Use simulation modes to test ideas before risking real money in live markets. This process shows which tradingview strategies match your risk tolerance and financial goals.
No software can replace your own decision-making process or professional financial guidance. Follow your rules, keep charts clean, and treat each session as a learning opportunity. A structured routine will help more than any single indicator or automated signal.
Our FAQs
Is TradingView a broker or just a charting platform?
TradingView is mainly a social-analysis and charting interface. You can execute trades on tradingview through supported brokers like Interactive Brokers or OANDA. However, TradingView does not hold funds or route trades directly. It connects to your brokerage account.
Can I use TradingView for day trading for free?
Yes, TradingView offers a Basic plan. However, its limits may hinder a professional tradingview tutorial workflow, including fewer tradingview indicators per chart and no intraday bar replays. Many day traders choose Essential or Plus for more features and faster data.
What are TradingView scripts and are they safe to use?
Tradingview scripts are custom indicators or strategies written in Pine Script. Many are useful, but community members create them. Always backtest these tradingview strategies and check that they do not “repaint” historical values before using real capital.
How do I get real-time data on my tradingview charts?
Some data may be delayed, depending on the exchange. For official real-time data from NYSE or NASDAQ, you usually need a paid TradingView subscription. You may also need a small monthly exchange fee for that data feed.
What are tradingview signals and how do I set them up?
Tradingview signals are alerts triggered by price levels or indicator conditions. Set them to send mobile push notifications, emails, or webhooks. They help you follow tradingview analysis without watching the screen constantly.
Can I practice trading without risking real money on the platform?
Absolutely. The tradingview platform includes Paper Trading. It lets you simulate tradingview strategies in real time. This builds confidence and tests your routine before you fund a live brokerage account.
Is the TradingView mobile app good for day trading?
The mobile app works well for monitoring tradingview charts and receiving tradingview signals while traveling. However, most professionals prefer the desktop version or TradingView Desktop for fast execution and multi-chart analysis.
How do I connect my broker to the TradingView interface?
Open the Trading Panel at the chart screen’s bottom. Select your provider, such as TradeStation or Interactive Brokers. Then log in with your broker credentials to start trading on tradingview directly.
Explore Our Exciting Related Products and Services